Data Analysis and Presentation
Data Analysis
2023
Data Analysis
Project info
Scope
The objective of this project was to analyze and visualize customer diversity within a mid-sized organization, focusing on dimensions such as gender, age group, nationality, job level, and department. The goal was to uncover representation gaps, turnover trends, and hiring patterns to support more inclusive, data-informed HR and strategic decisions.
Progress
1. Data Preparation
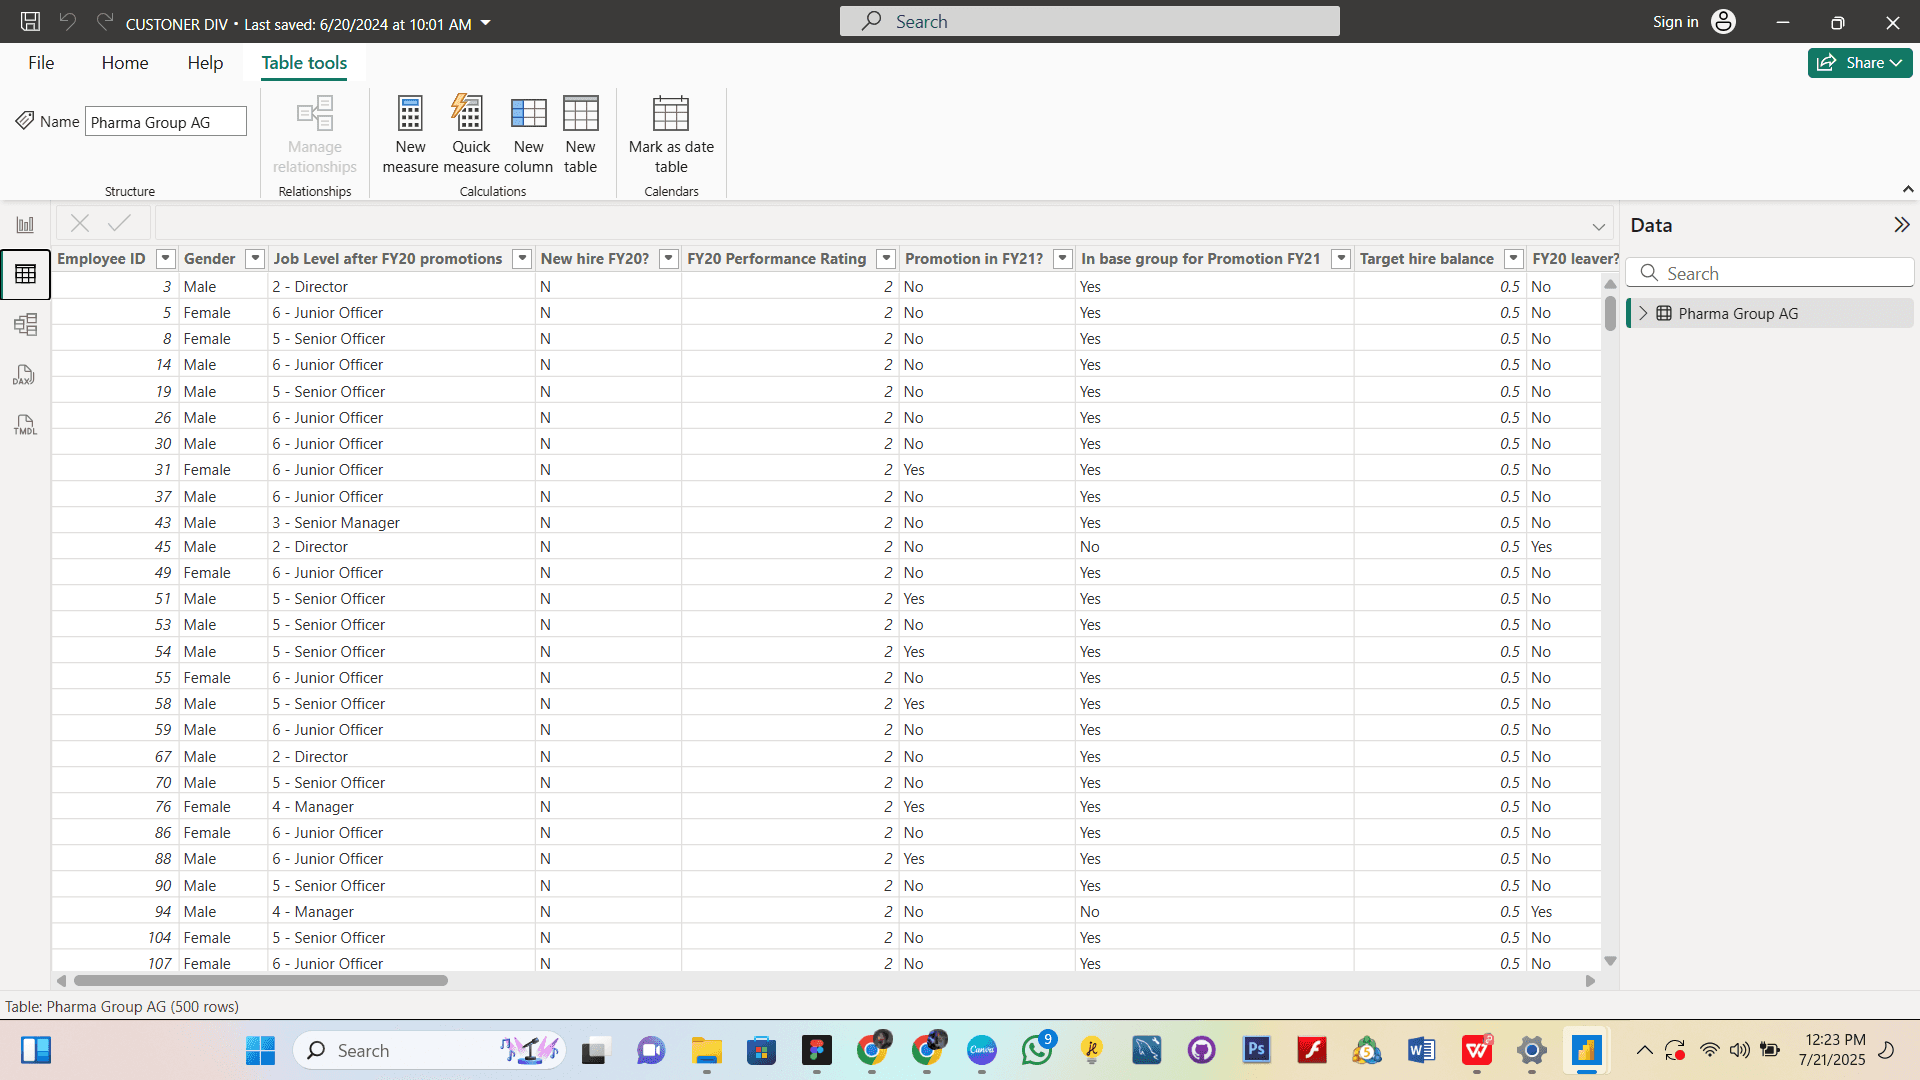
Imported raw employee demographic and HR data from Excel/CSV files.
Cleaned and standardized data in Python using Pandas (e.g., missing values, inconsistent labels).
2. Exploratory Data Analysis (EDA)
Analyzed distribution of employees by gender, age group, nationality, department, and job level.
Calculated key HR metrics: turnover rate, hiring rate, gender distribution, and promotion percentage.
3. Visualization & Dashboarding
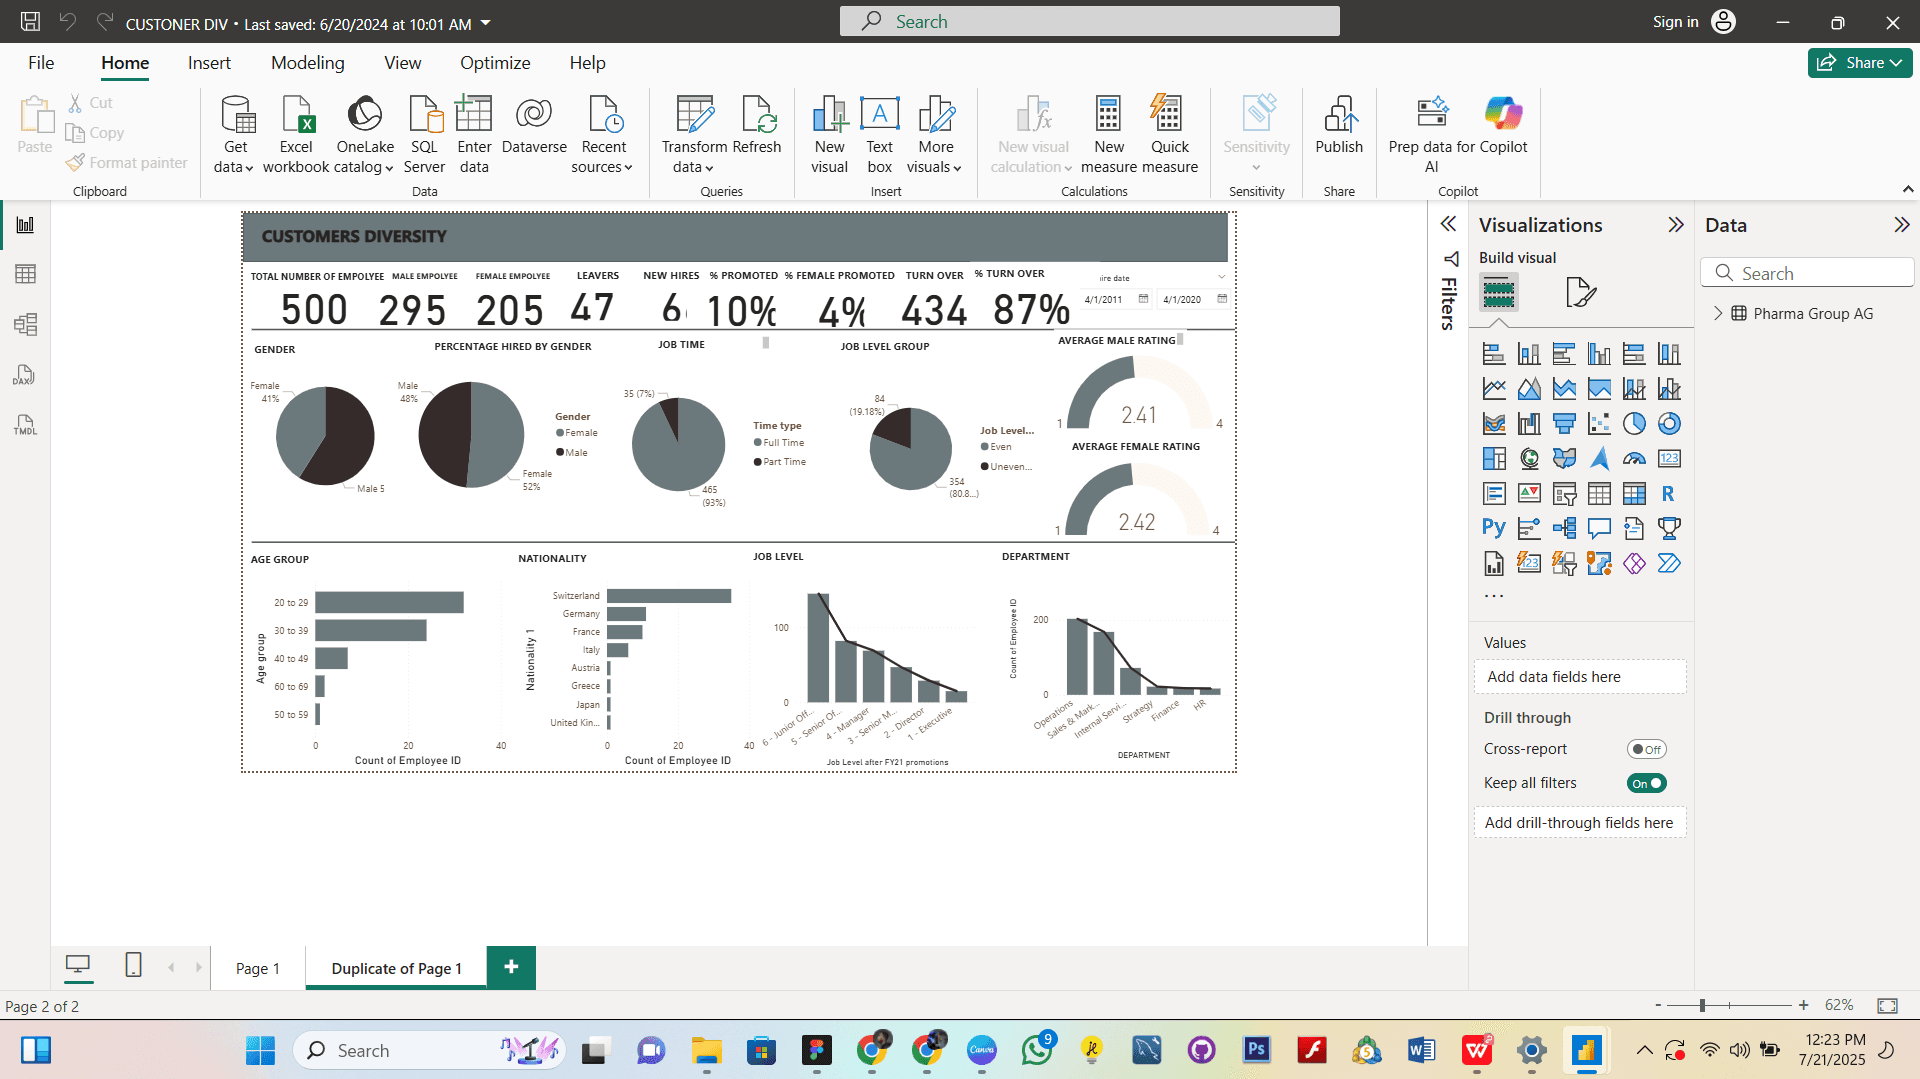
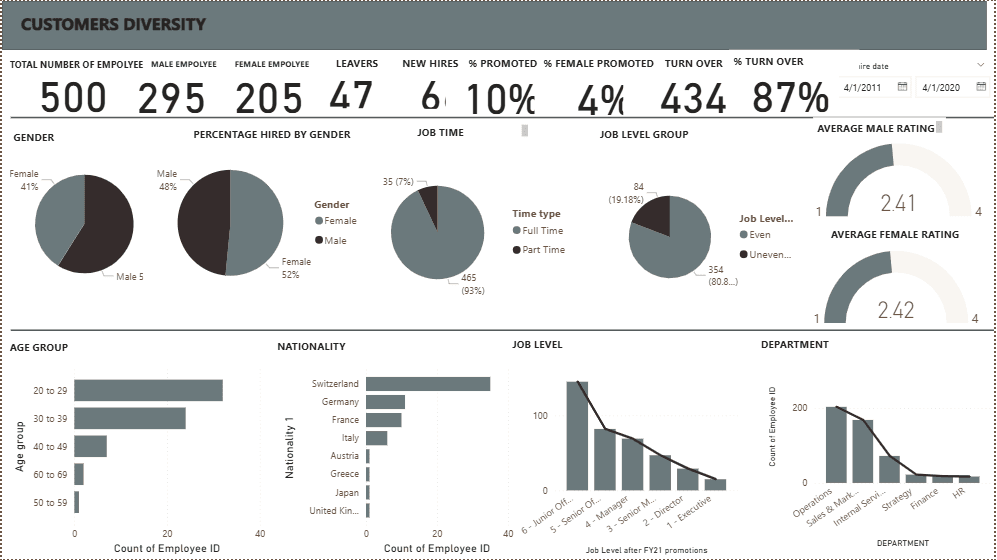
Designed an interactive dashboard using Power BI to visualize:
Gender breakdown and hiring trends
Job level groupings and department diversity
Turnover patterns and promotion rates by gender
Average ratings by gender and job time (full-time vs. part-time)
Added filters for time range (e.g., 2011–2020) to observe changes over time.
4. Insight Generation
Found underrepresentation in leadership roles for women and specific nationalities.
Identified departments with high turnover and low female promotion rates.
Highlighted a gap between average performance ratings by gender.
Solution
The final deliverable was a comprehensive Power BI dashboard that enabled HR and leadership teams to:
Monitor diversity KPIs across time and departments.
Identify actionable gaps in hiring, retention, and promotion practices.
Support policy planning for more equitable talent development and inclusion efforts.
This project led to deeper awareness of workforce imbalances and informed the company’s DEI (Diversity, Equity, and Inclusion) strategy moving forward.